Postprandials, Thursday, 31 January, 2013

XJO – Daily
In Australia:
- Twenty Leaders -0.5%
- 50 Leaders -0.4%
- XJO -0.4%
- XAO (All Ords) -0.4%
- Small Ordinaries -0.3%
- Financials -0.2%
- Materials -0.4%
- Consumer Staples -1.1%
- Energy -0.8%
- Health -1.1%
- Telecoms +0.2%
- Consumer Discretionary +0.3%
- Utilities -1.1%
- The XJO finished at 4878.8. Today’s candle was technically a bearish engulfing candle, but the size was relatively modest.
- Stochastic: 92.7. Overbought, but falling below its signal line.
- RSI: 80.5. Very Overbought. Still above its trend line from mid-November.
- MACD Histogram. Above zero but falling. Short term longs will now be out of this market.
- MACD: Above zero. Positive. Negative divergence possible setting up.
- CCI: +130.9. Overbought.
Today’s action was the biggest fall since 8 January, but still modest. The chart hasn’t gone anywhere near the middle Bollinger line (20-Day MA) since late November, 2012. It’s normal for that to be tested and then rebound. If that rebound fails, we could be looking at something serious to the downside; but, at the moment, bulls are still sitting pretty.
Here’s the Small Ordinaries Chart. XSO often leads.
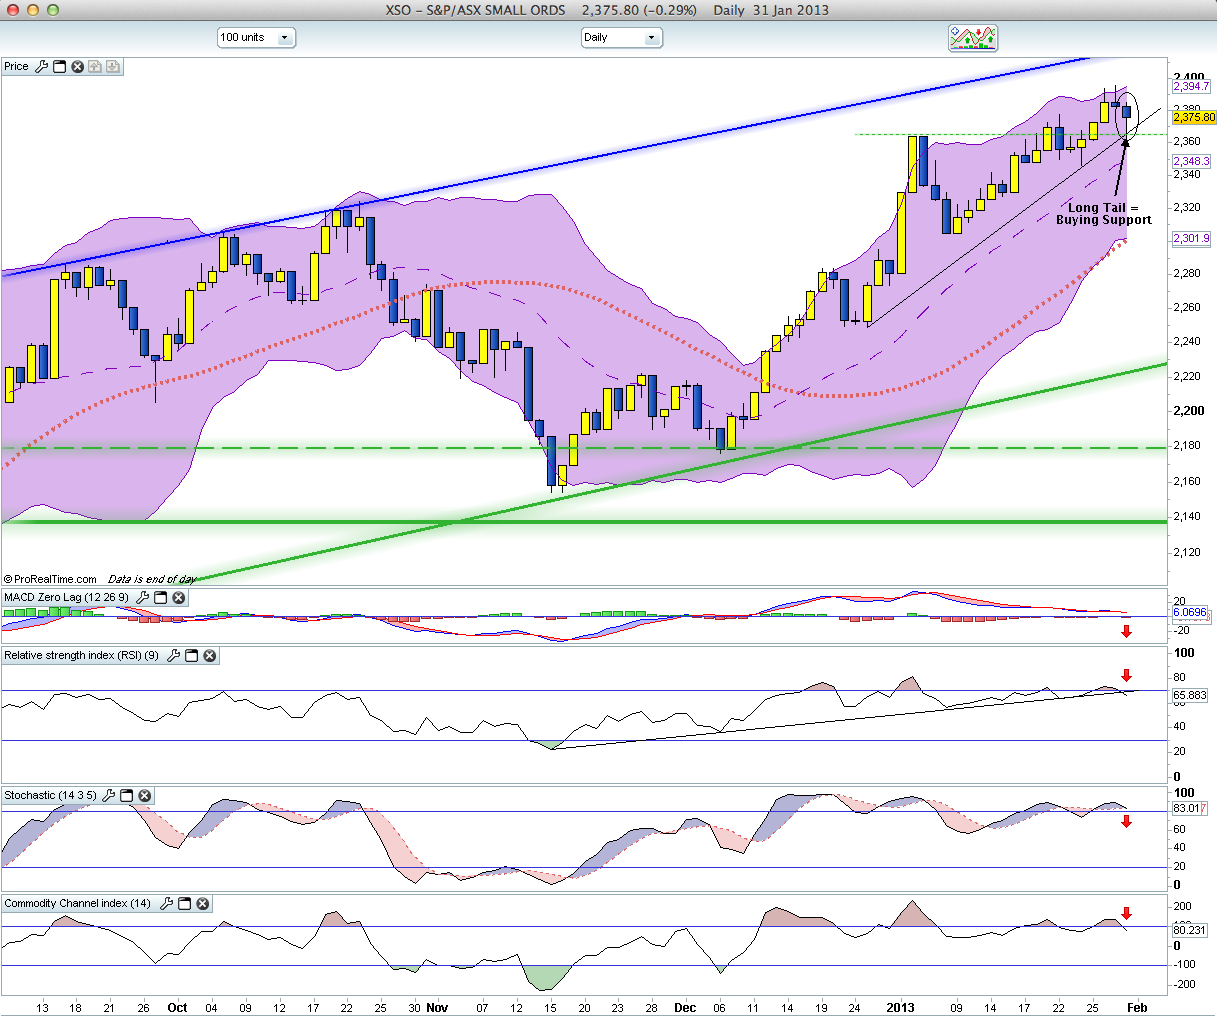
Small Ordinaries – Daily
This provides some cause for concern. Indicators have given a consensus sell signal. But today’s candle shows a long lower tail, suggesting buying support – right at horizontal and oblique support.
The chart hasn’t been as strong as the XJO suggesting some lack of relative strength in the broad market; i.e., the market has largely been dependent on strength in the big blue chips. That’s always a concern.
However, at this stage, there is not enough evidence to suggest we’re in anything but “pause” mode. I’m quite willing to allow the market to prove me wrong. 🙂
Redbacka
