Archive
Saturday Morning Joe. 22 July, 2017.
In Australia yesterday:
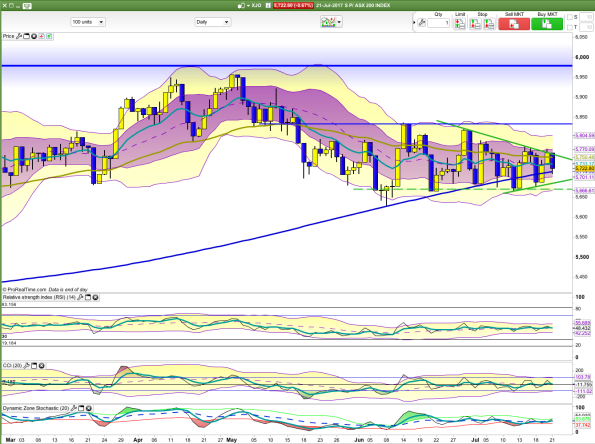
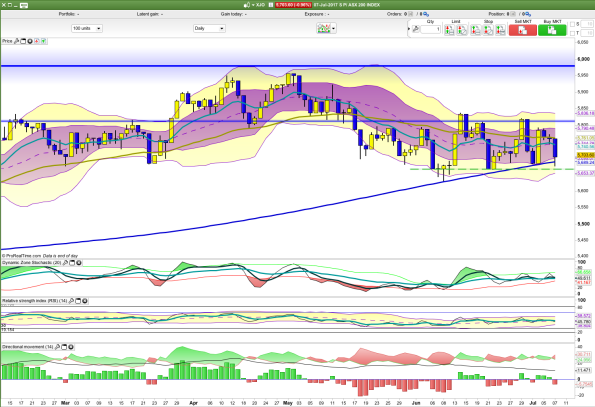
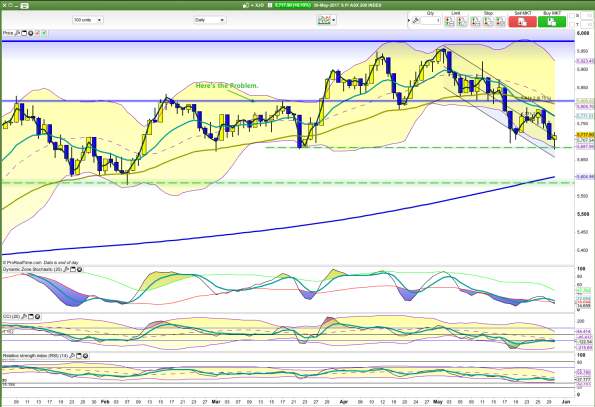
XJO down -0.67%. Nothing new for the longer term investor. XJO continues its rather volatile sideways slide. 15/20/49 Day MAs are all sliding sideways. Wait.
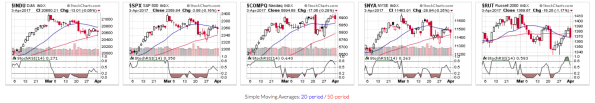
In U.S.
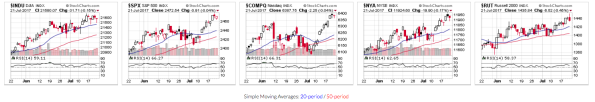
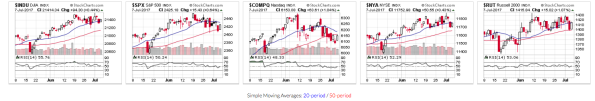
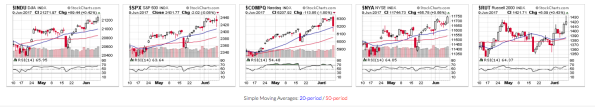
DJ -0.15%, SP500 -0.04% Nasdaq -0.04%, NYA -0.17%, Russell2000 -0.46%. Except for R2K, early losses in the major indices were largely erased with minor losses the final result. In R2K, early gains were erased with a final moderate loss.
Banks Index -0.26%.
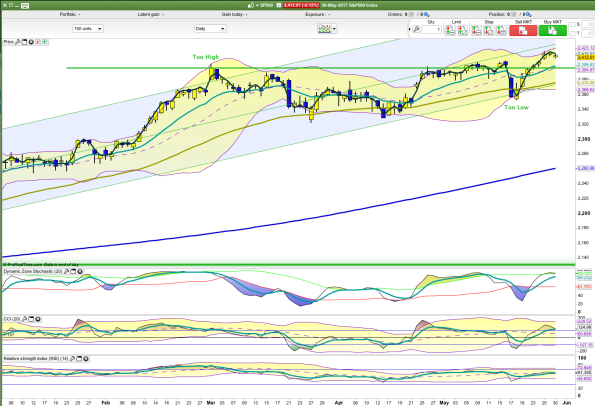
SP500:
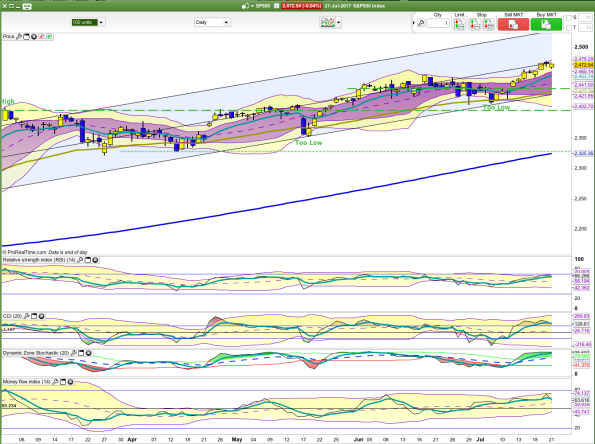
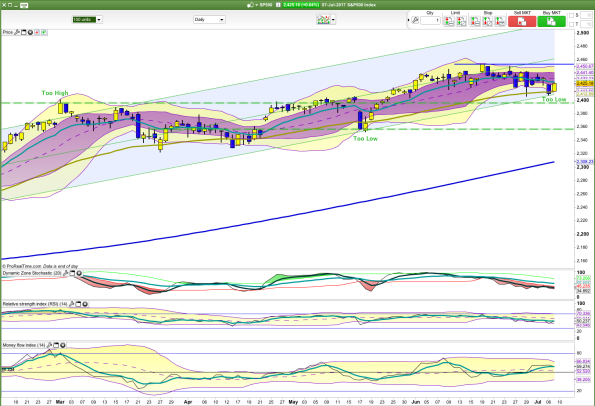
The long-term uptrend remains in place. Today was a pause day in the short-term uptrend. Indicators have lost a little ground and a big down day would signal a pull-back.
Commodities:
DBC -1.37%. Energy -2.38% Industrial Metals +0.49%. Copper Producers ETF was +0.09%. Gold +0.86%. Iron Ore -3.2%
VIX
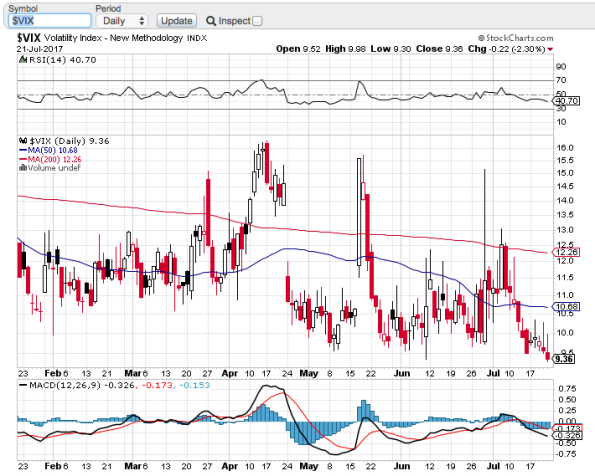
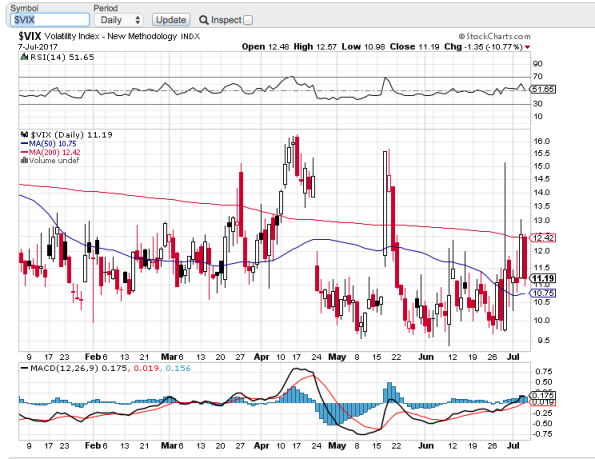
VIX is at 9.36 which is exceptionally low. The all-time low is 9.3 set in the early 1990s. Nothing much bad can happen while it remains at these levels, but that can change quickly.
RB.
Saturday Thoughts. 8 July, 2017.
In Australia yesterday:
XJO remains in a range, coiling around the 20-Day MA. The 200-Day MA provides support.
Some odd things happened yesterday in our market. A.VIX shot way up, well above the highs seen in recent months. That’s usually a sign of fear in the market. At the same time, the number of stocks traded has dropped off to a very low point. Usually, fear in the market sees the number of stocks traded rise sharply. Odd. This looks like a couple of big punters shoving the market around using options to do it.
In U.S.
DJ +0.44%, SP500 +0.64% Nasdaq +1.04%, NYA +0.43%, Russell2000 +1.07%. The Jobs Report was out last night, and the American market responded positively.
XLF (Financials) up +0.68%.
SP500:
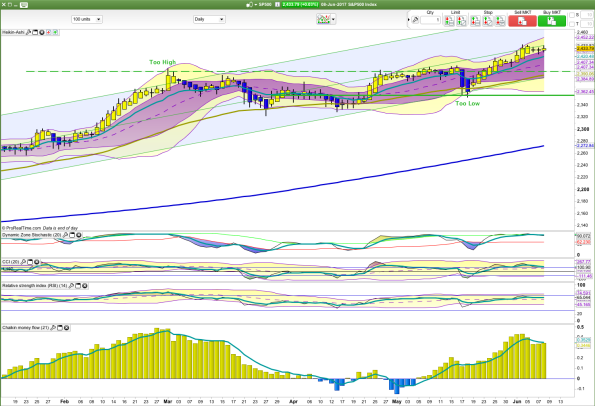
The long-term uptrend remains in place. Within the uptrend channel, the SPX is now trending down. A positive divergence on the MFI is promising, but we need to see a break of overhead resistance. Last night’s action was modestly bullish in the short-term.
Australia’s correlation with the SPX is insignificant (0.11), but has a weak correlation (0.42). That helps a little. The commodities pricing also helps a little.
Commodities:
DBC -0.97%. Energy -1.93% Industrial Metals -0.12%. Copper Producers ETF was flat +0.1%. Gold -1.02%.
We haven’t seen a move into safe-havens (U.S.$, Gold and Bonds). So the sabre-rattling over North Korea isn’t playing a part.
U.S. Volatility
U.S. VIX Index fell away sharply from the 200-Day MA last night. That’s a bullish move.
After yesterday’s big drop in Australia, I’d expect a move to the upside on Monday. Monday’s usually low volume should help the big punters if they decide to push the index higher.
RB.
Saturday Morning Joe. 10 June, 2017.
In America:
Lots of diverse action in Indices. DJ +0.42%, SP500 -0.08%, Nasdaq -1.8%, NYA +0.56%, Russell2000 +0.43%.
XLF (Financials) up very strongly +1.89%
SP500:
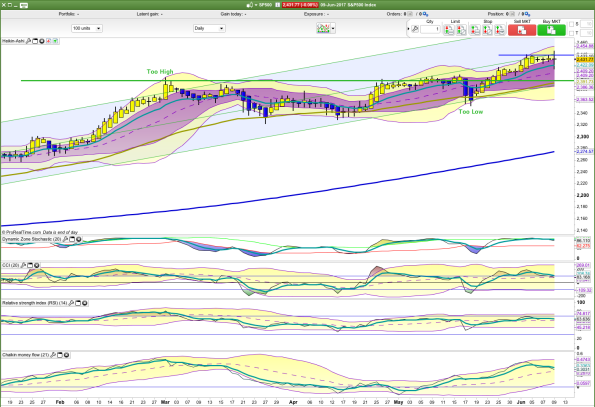
Nothing much has changed in the SP500. H-A candle today saw another doji candle and suggesting a possible trend change. The middle (Regression) line of the Standard Error Channel has been acting as resistance since late March. All indices are showing short-term sell signals. This is an indecisive chart. Wait.
Australia remains uncorrelated with the broad American market. The commodities pricing helps a little but the major American indices are not much assistance.
Commodities:
DBC +0.56%. Energy +0.61% Industrial Metals +1.09%. Copper Producers ETF was up +0.82%. Gold -0.91%.
BHP down overnight in the U.S. -0.56%. In London it was up +2.07%. Currency movements don’t explain the big discrepancy between the U.S. and London. It’s all
It’s all getting a bit weird. Techs getting belted. IMs going gang-busters. Financials going gang-busters. Big discrepancies in BHP prices between London and the U.S. Beats me. Think I’ll go and get me a T-Shirt for the times:

RB.
Friday Morning Joe. 9 June, 2017.
In America:

DJ, SPX and NYA were flat. Nasdaq up modestly. R2k is now playing catch-up with today’s big jump. That’s a positive. DJ +0.04%, SP500 +0.03%, Nasdaq +0.39%, NYA +0.1%, Russell2000 +01.36%.
XLF (Financials) up strongly +1.15%
SP500:
Nothing much has changed in the SP500. H-A candle today saw another doji candle. The middle (Regression) line of the Standard Error Channel has been acting as resistance since late March. RSI was showing a short-term sell signal – that’s now cancelled. CCI remains on a short-term sell signal. This is an indecisive chart. Wait.
Australia remains uncorrelated with the broad American market. The commodities pricing helps a little but the major American indices are not much assistance.
Commodities:
DBC flat +0.00%. Energy flat -0.09% Industrial Metals +1.04%. Copper Producers ETF was up +0.25%. Gold -0.65%. Iron Ore -0.2%.
Copper Producers ETF was up strongly 2.43%. That’s a good sign for our Miners today. BHP up overnight in the U.S. +2%.
Pre-markets are looking soft. So we’ll probably open down a little. Given yesterday’s intra-day strength, we’ll probably see more of the same today.
RB.
In Australia yesterday:
XJO was up +0.19% after being in negative territory early in trading. This bullish reversal provides some hope that we are seeing a bottom in our market. Big banks did well: ANZ +0.76%, CBA +0.7%, NAB +1.57%, WBC +1.03%. The daily candles for NAB and WBC both show bullish engulfing candles. Coming at the low ends of long downtrends, those are good positive results.
In America:

DJ -0.24%, SP500 -0.12%, Nasdaq -0.11%, NYA -0.26%, Russell2000 -0.8%. Last week, the American market had a good run, so it’s not surprising we’re seeing a little weakness
Financials were weak in America (-0.68) after rumours of problems in European banks (particularly Italy). Whether or not that will flow on to Australia is still to be seen.
SP500:
SP500 had been up seven days in a row. That’s a rare bullish stretch. The day after Memorial Day has a history of being weak. I wouldn’t be surprised to see a test of the old resistance level as support.
Commodities:
DBC -0.81%. Energy continues to fall -0.89% Industrial Metals -0.56%. Copper Producers ETF was down -0.56%. Gold -0.33%. Iron Ore -0.1%.
Despite the good rise in Westpac yesterday (1.03%), it was down in America last night (-0.22%). The Ozzie dollar wasn’t a factor as it was up +0.21%. That suggests the jitters about the banks in Europe will flow on to us today.
I expect we’ll be flat today.
RB.
Tuesday Morning Joe. 4 April, 2017.
DJ -0.06%, SP500 -0.16%, Nasdaq -0.29%, NYA -0.25%, Russell2000 -1.17%. Long lower tails on candles (except R2K) indicate intra-day buying. So bulls retain some strength.
Commodities:
Although IMs were down, ETF tracking Copper producers (COPX) was up +1.11%.
We’ll have another sloppy day today, Unlikely to be positive, but watch the afternoon trading for some buying pressure.
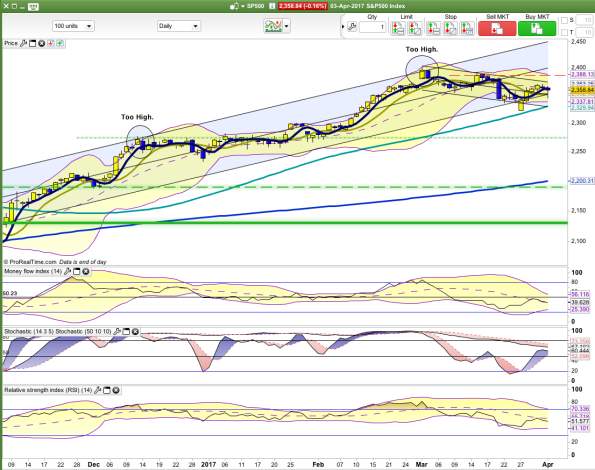
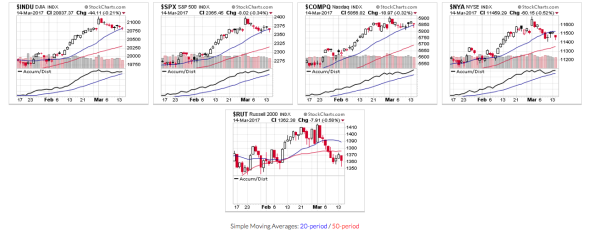
Wednesday Morning Joe. 15 March, 2017.
DJ -0.21%, SP500 -0.34%, Nasdaq -0.32%, NYA -0.52%, Russell2000 -0.58%. Losses were modest to moderate. Intra-day buying is evident.
This remains an indecisive market waiting on the FOMC meeting decision, and, probably more importantly, the message which goes with the decision.
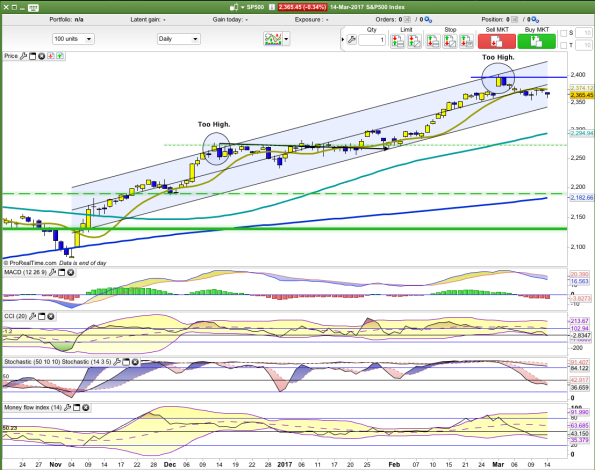
SP500 was down modestly -0.34%. Volume dropped off. That’s showing a decided lack of conviction. But – we did see a degree of intra-day buying.
I’d like to see a sharp drop down to the lower line of the Standard Error Channel. Then we might get a solid rally.
VIX
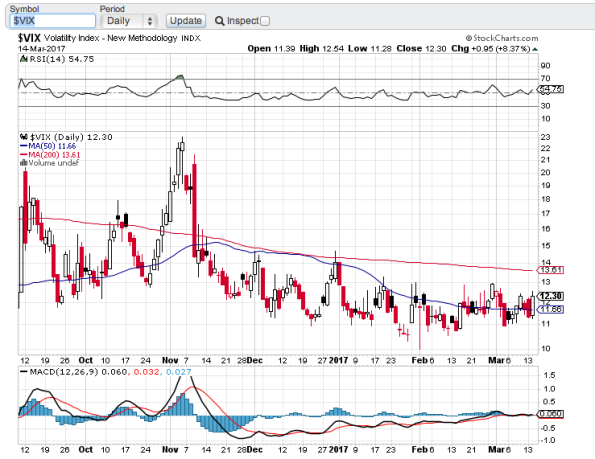
VIX rose strongly last night (inverse to stocks). Punters took out insurance against the upcoming FOMC decision. Some are clearly getting nervous about what the reaction of the market will be.
Commodities:
The Energy Sector fell again -0.41%. That drove the broad commodities index into negative territory, DBC -0.4%. Industrial Metals down a little -0.19%. Gold -0.54%. Iron Ore +0.6%.
Our banks are in a downside swing cycle. Miners are in an upside swing cycle. Financials outweigh Materials – so we can expect our market to go down today after those weak American numbers.
Choppy March markets tend to drive prices up early in the month and batter stocks at month end.
Julius Caesar failed to heed the famous warning to “beware the Ides of March” but investors would be served well if they did. Stock prices have a propensity to decline, sometimes rather precipitously, after mid-March.
Well, the markets have fallen in America in the first half of March this year. Does it then follow that the inverse will occur in the second half? If only ….
RB
Tuesday Morning Joe.15 November, 2016.
In America:
Russell2000 continued its strong up trend, others have slowed or are bogged in sideways indecision. The R2K upward rush is fed by a perception that The Donald is good for small business. DJ +0.11%, SP500 -0.01%. Nasdaq -0.36%. New York Composite +0.26%. Russell 2000 +1.26%. Volumes remain very high. R2K and DJ are both now overbought with RSIs above 70.
NYSE NewHigh/NewLow Ratio fell a little, now 51.7%. NLs remain at an unacceptably bearish level, up from 181 to 330. The extremely high NL figure is caused by falls in fixed income issues on the NYSE. Interest rates are going up and this affects the prices of bonds and associated fixed income issues on the NYSE. People with their investments in “moderate” or “balanced” accounts might find that their portfolios have actually gone down rather than up in this Trump powered market rise. For the cautious investor the Trump world might prove to be a dystopian Brave New World.
SP500:
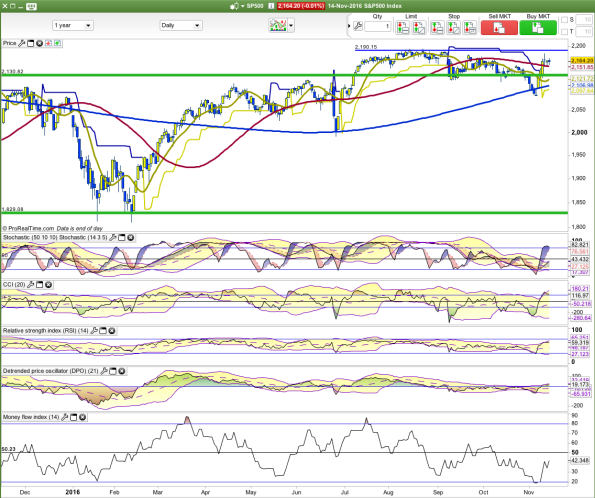
SP500 was flat. Today’s doji candlestick is the third in a row. Indicators are still not overbought, so it has some chance of continuing higher and through resistance. The next couple of days will be important. There are positives. The SP500 is above the 65-Day MA and the 13-Day MA has moved up. The Long Term Stochastic (50.10.10) seems to have bottomed out and has turned up. A break above the major horizontal resistance level would be very bullish.
Commodities:
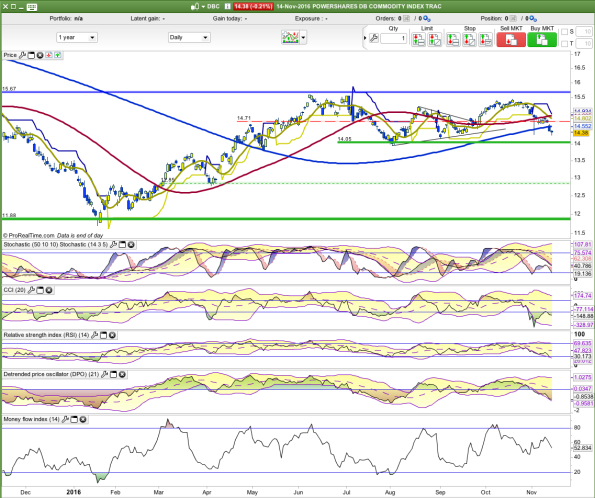
DBC down -0.21%. The DBC is now very oversold. CCI is showing a potential positive divergence. So we may be coming to the end of this down trend.
Energy -0.09%. Industrial Metals +1.74%. Gold -0.85%. Copper (US$/t) +0.2%. Iron Ore unchanged. The good figure for IMs was skewed by big rises in Lead and Zinc.
We didn’t do much yesterday so probably much of the same today. If there is a surprise, I think it will be to the upside. Yesterday ANZ and NAB did well in a falling market (discounting the ex-dividend effect for ANZ). The banks could see some positive action today.
RB.
Wednesday Morning Joe. 28 September, 2016.
In America:
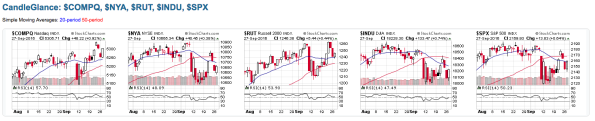
Gap filled on Nasdaq. Overhead gaps remain on New York Composite, Dow Jones and SP500. DJ +0.74%. SP500 +0.64%. Nasdaq +0.92%, New York Composite +0.38%, Russell 2000 +0.44%. Breadth was relatively poor.
NYSE NewHigh/NewLow Ratio is bullish at 79.4%. New Lows rose to 21 – that’s still not a threatening figure, but NH/NL Ratio is deteriorating a little.
SP500:
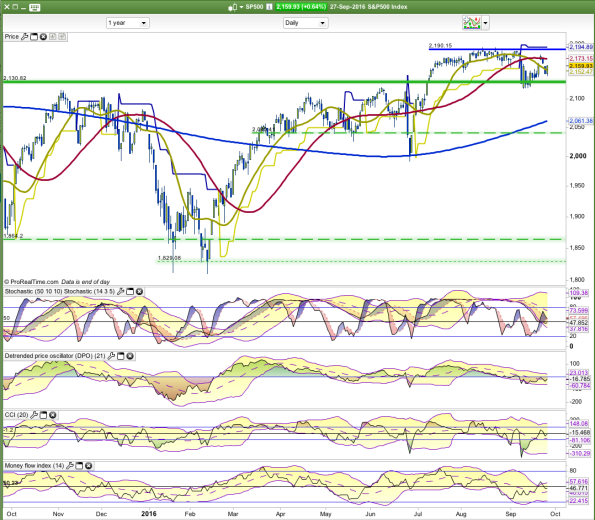
The Index is showing a lot of indecision, up one day, down the next. Indicators are about mid-range. This can go either way. But the structure still suggests a downside move to test the recent lows.
Commodities:
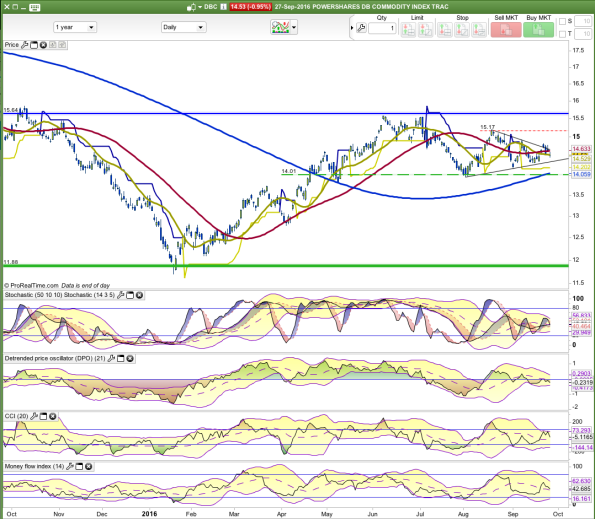
DBC, the Commodities Index tracking ETF, down -0.95%. It remains in the symmetrical triangle. Energy -2.65%. Industrial Metals +0.07%. Gold-0.73%. Iron Ore +0.4%. Notice how the long term Stochastic (50.10.10) and the short term Stochastic (14.3.5) have converged at the 20-Day MA (Middle Bollinger Band) for the long term Stochastic. That’s about as indecisive as it gets.
Expect a range day today, probably within yesterday’s range.
RB.
Tuesday Morning Joe. 20 September, 2016.
In America:
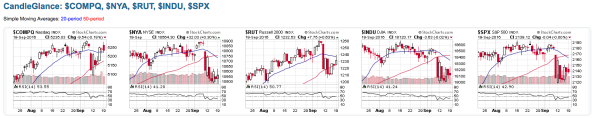
Dow Jones -0.02%, SP500 -0.00%, Nasdaq -0.18%, New York Composite +0.3%, Russell 2000 +0.3%. This is looking increasingly bearish. NYA, Dow Jones and SPX all show significant negative cross-0vers on the 20/50 Day MAs. The indices were up early in the day but significant intra-day selling occurred. The one bright spot was the good breadth showing up on NYA and R2K. I mentioned in the Weekend Report that the strong action in Apple was, in fact, bearish (3-Gap Up Pattern). Apple was down -1.17% and had an obvious impact on Nasdaq.
NYSE NewHigh/NewLow Ratio remains bullish, 81.7%. New Lows are at 15. That’s a benign number.
SP500:
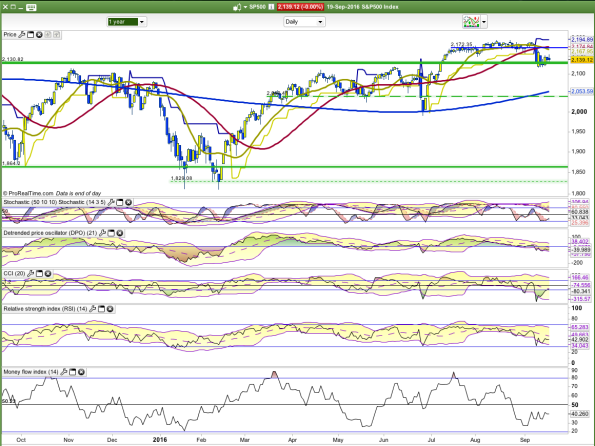
The Index hasn’t broken below horizontal support. A short term upside movement remains probable. The big problem for SPX is the negative cross-over of the 20/50 DMAs. That level is coincident with a horizontal resistance level. Powerful negative stuff. The likely scenario is that the SPX will rise up to the 20-Day MA and then fall. If, the less likely scenario, the SPX can push back above the 20/50Day MAs and that horizontal resistance level, the bulls will be back in the game. There’s no sign yet that the less likely scenario is coming into play.
Commodities:

DBC, the Commodities Index tracking ETF, more or less flat -0.07%. Energy -0.26%. Industrial Metals +0.68%. Gold +0.21%.
DBC is in a small symmetrical triangle. A break out either way should tell us more about future direction.
There’s not much to go on from the American market last night. It is in wait-and-see mode ahead of the next FOMC meeting. We’ll also probably have a quiet narrow range day. It will be interesting to see if volume picks up today after the glitches of yesterday restricted trading on the ASX.
RB.
